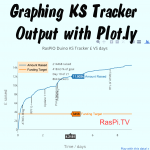
I’d never done graphing on the Pi or in Python before, but for my KickStarter tracker I wanted something that… was web based would work in Python had decent instructions I could get going with fairly quickly I’d seen Rachel Rayns tweet about using plot.ly for graphing the temperature output of her Chef’s HAT sous vide cooker. I know Rachel loves “human readable instructions”, as do I. So I thought there was a good chance the plotly documentation was good. I decided to give them a shot. Sign Up For An Account The first thing […more…]